Introduction
Public engagement often produces a large number of comments, but those comments are not always treated as structured information. They are summarized in reports or meeting notes and can easily become disconnected from the decisions they were meant to inform. The challenge for planners is making sense of these comments efficiently, being able to retrieve relevant information later, and organizing themes in a consistent way so that public input becomes actionable rather than anecdotal.
Vector embeddings offer one way to approach this problem. They require some technical setup, but tools for generating and analyzing embeddings have become increasingly accessible. These tools should support analysis rather than replace human interpretation.
Used carefully, embeddings make it possible to analyze large volumes of public feedback while preserving the nuance of what people actually said.
What is a vector embedding?
A vector embedding is a numerical representation of text. The numbers are generated by a machine learning model trained to capture patterns in language and meaning. When two pieces of text express similar ideas, their numerical representations will also be similar.
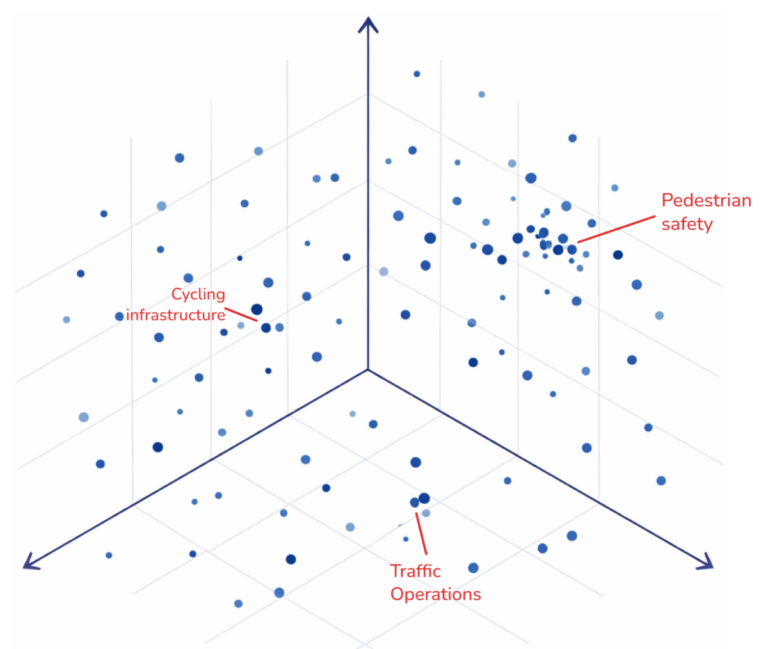
In practice, this means that comments expressing related ideas tend to appear close together in the dataset even when they use different wording. For example, comments such as “more bike lanes,” “safer cycling infrastructure,” and “protected bike paths” would likely produce embeddings that are close to one another.
Because embeddings are numerical vectors, it is also possible to measure the distance between them. This distance can be used to estimate how similar two comments are, which makes it possible to cluster comments by topic or retrieve comments related to a particular theme.
Models for generating embeddings are widely available. For example, Google’s Embedding Gemma model can be downloaded from Hugging Face and run locally on a personal computer.
Best Practices
Existing approaches to analyzing comments
Planners are often tasked with analyzing public comments in a structured manner. The APA’s recent PAS memo describes a framework developed for analyzing input gathered for the Memphis comprehensive plan. This framework treats community input as something that can be tracked, categorized, and analyzed rather than anecdotes simply summarized in a report.
With this approach, planners code comments into themes using spreadsheet tools like Excel or Google Sheets. Comments that refer to similar issues (for example, illegal dumping, code enforcement response times, or property maintenance) are grouped into categories so patterns can be identified across meetings or neighborhoods. The framework then compares these themes across districts and uses simple metrics to measure how frequently they appear and how widely they are shared. The key idea is straightforward: public input should be treated as analyzable data rather than anecdotal feedback.
The approach described in this post builds on that same idea but uses newer tools to make the process faster and easier to explore.
Embeddings Approach
In a traditional workflow, planners typically read through comments and manually assign categories in a spreadsheet. Over time, these categories become a list of themes, which are summarized in a report. This process works, but it requires a significant amount of manual data entry and can be difficult to update later if new themes emerge.
An embedding-based workflow approaches the same problem differently. Instead of tagging each comment individually, the comments are first converted into embeddings and plotted as a “meaning map.” From there, clusters can be explored visually and themes can be identified by examining groups of related comments. The final output is still a summary report, but the exploratory process happens in a more flexible way.
Key differences:
- Manual workflows require a significant amount of time for data entry and classification. When many people are coding comments, inconsistencies can also emerge in how categories are defined or applied.
- Embedding-based workflows reduce the need for manual tagging and make it easier to explore the dataset interactively. Instead of committing to a fixed set of categories at the beginning, themes can emerge as you examine clusters of related comments.
- Embeddings also make it easier to revisit the dataset later. If you want to create a new category, you do not need to re-tag every comment. Instead, you can compare the new category description to the embeddings and immediately retrieve the most similar comments.
Important Limitations:
- Clustering is not perfect, and dimensionality reduction can sometimes distort relationships between comments.
- Embeddings capture patterns in language but cannot fully understand context or intent.
- Planners still need to read representative comments and interpret the results carefully.
Embeddings are best treated as a discovery tool that helps surface patterns in large collections of comments. Human judgment is still required to interpret those patterns and translate them into planning decisions.
Workflow
A practical workflow can be broken into three steps: generating embeddings, exploring them visually, and then interpreting the patterns you find.
First, the comments need to be converted into embeddings and stored in a format that can be used later. This can be done in a Python notebook, and Google Colab works well for this because it requires very little setup. A typical workflow uses a model such as Embedding Gemma to generate a vector for each comment, then stores those vectors alongside the original text and any metadata such as meeting location, date, or respondent group. Libraries such as pandas help organize the data, while tools like numpy and scikit-learn make it easy to normalize vectors and build a similarity index for fast searching. The results can then be saved as a CSV, Parquet file, or another structured format so the dataset can be revisited without recomputing everything from scratch.
The next step is to make the embeddings explorable. Because embeddings often have hundreds or thousands of dimensions, they need to be projected into two or three dimensions for visualization. This is usually done with dimensionality reduction methods such as UMAP, which is popular because it often preserves local relationships better than simpler methods like Principal Component Analysis, or PCA. The resulting coordinates can then be plotted with libraries such as matplotlib, plotly or pydeck for interactive exploration. This step is useful, but it requires caution. Just as any geographic map introduces distortion when the earth is projected onto a flat surface, a two dimensional embedding plot simplifies and distorts a much higher dimensional space. The visualization is best treated as an aid to exploration rather than a literal map of meaning.
Once the embeddings are indexed and visualized, the real analytical work begins. This is where planners can start asking questions of the dataset. Which comments cluster together? What topics dominate in one neighborhood but not another? Are similar concerns appearing across different meetings even when people use different language? By clicking through clusters, reading representative comments, and comparing nearby points, it becomes much easier to identify emerging themes. The same embedding index also makes retrieval much faster. Instead of manually filtering spreadsheets, an analyst can search using a phrase such as “pedestrian safety near schools” and quickly pull the comments that are most semantically similar. In practice, this makes it easier to test categories, refine themes, and move back and forth between broad patterns and individual comments without having to rebuild the analysis each time.
Conclusion
Public engagement often produces large volumes of qualitative data, and planners already use structured methods to interpret it. Embeddings provide a new method that can support this process by helping planners explore patterns, retrieve related comments, and work more efficiently with large datasets.